Two apartment layouts each fit 80 homes on the same site. Both use 90,000 square feet of residential building area. On a first pass, the choice looks like a tie. Then the architect puts the typical floors side by side: one plan spends more area getting residents from the elevator to their front doors. Where does that difference show up in the feasibility study?
One place to look is net rentable square feet (NRSF). It gives the development team a way to compare how much apartment space each layout delivers before choosing a concept to develop further.
What does NRSF mean in real estate?
NRSF stands for net rentable square feet. In a multifamily feasibility study, a team might use residential NRSF to mean the combined rentable area of the apartments. Gross floor area measures a broader total: the apartments plus space such as corridors, stairs, elevators, and shared rooms. Those spaces serve residents, but in this calculation they do not count as apartment area.
Write down what each number includes. For example, if the architect’s schedule includes balconies in unit areas but the developer’s rent assumptions cover only apartment interiors, the same label can describe two different totals. For a mixed-use building, keep retail and residential area separate so a larger storefront doesn’t make the apartments appear more efficient.
How to calculate net-to-gross efficiency
Divide residential NRSF by the corresponding gross residential floor area, then multiply by 100. Use the same area boundary for every option. If a garage is included in one gross area total and excluded from another, correct the totals before comparing percentages.
Consider this illustrative comparison. Both options use the same unit-type proportions. Gross residential area includes apartment interiors, circulation, and shared residential spaces; it excludes parking, retail, and balconies. The unit areas below are averages across all homes.
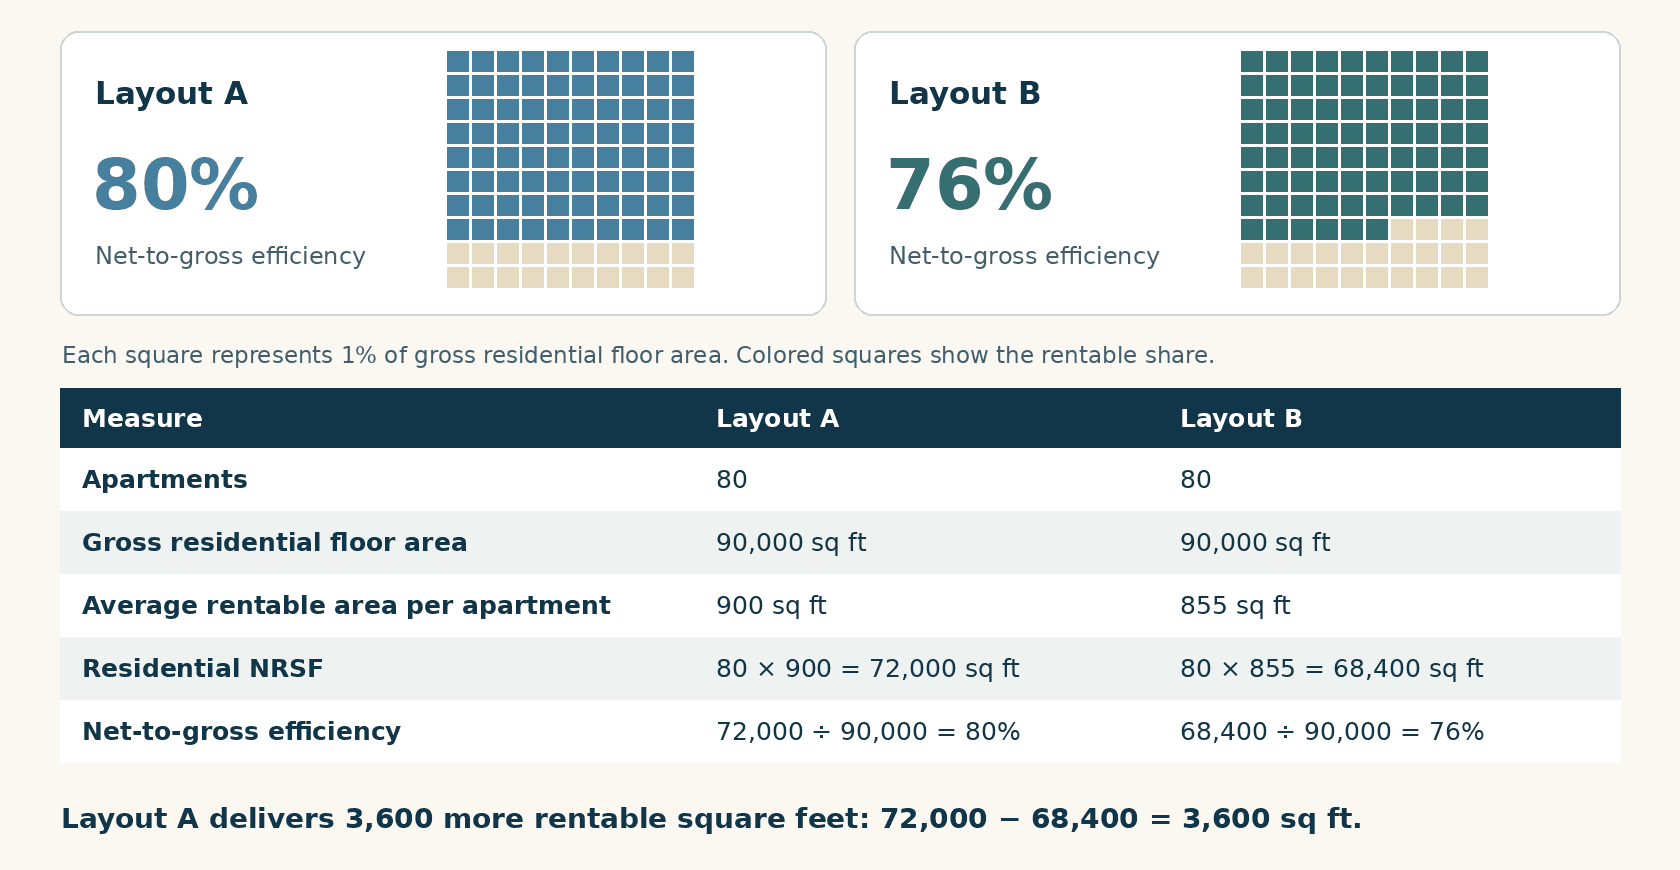
Layout A delivers 3,600 more rentable square feet in the same building area (72,000 − 68,400). That works out to 45 square feet per home on average. The four-percentage-point gap tells you how much area to investigate. It doesn’t tell you where that area went or what it is worth.
What to check before choosing the more efficient plan
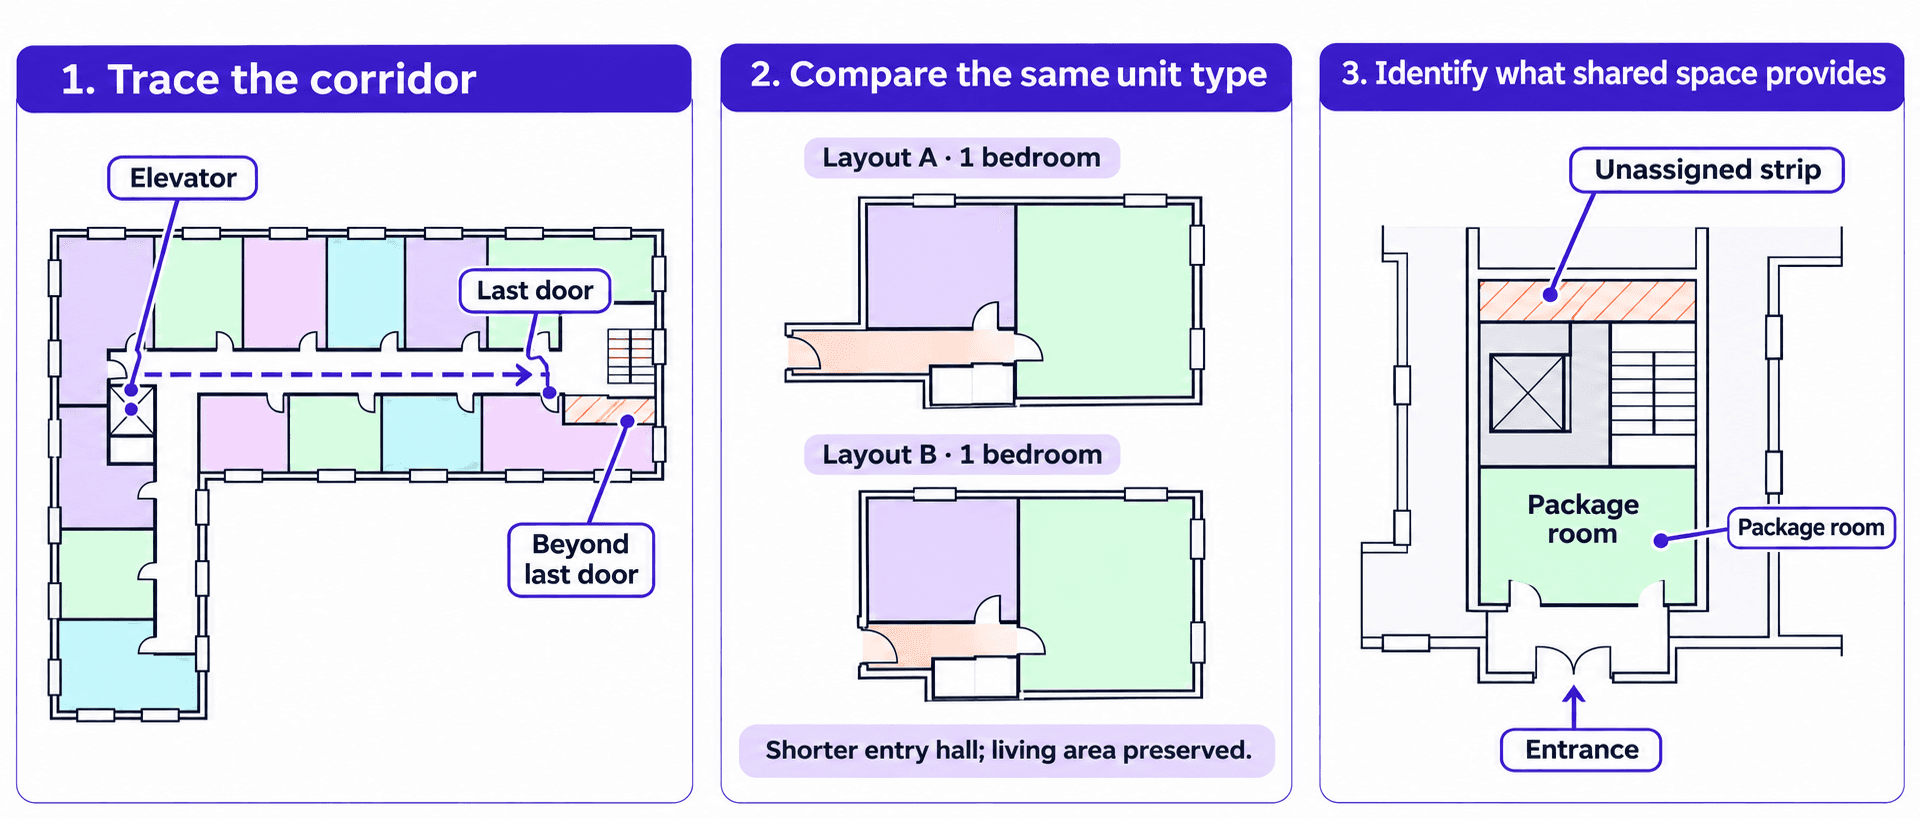
Trace the route from the elevator to the last apartment. On each typical floor, mark the corridor, elevator lobby, and turns. Is one corridor longer because it serves more front doors, or does it continue past the last door? Repetition matters: an extra 120 square feet of corridor on each of five identical floors accounts for 600 square feet. In the example above, that would explain only part of the 3,600-square-foot difference.
Find the difference inside the apartments. An average can hide which homes got smaller. Compare a typical one-bedroom in each layout: did it lose a usable dining area, or did a shorter entry hall preserve the same living space? Compare like unit types before assigning value to the extra square footage.
Name what the shared space buys. If Layout B puts a package room near the entrance or gives residents a more direct route from the garage, record that alongside the area change. A lower ratio may be a trade the team wants to make. If the extra area is an unassigned strip behind the core, that is a specific piece of the plan to revisit.
How to use NRSF in a development feasibility study
Match the comparison to the way you estimate rent. If both layouts have 80 apartments and you assign the same monthly rent to each corresponding unit type, extra square footage alone adds no modeled rent. If you price by rentable square foot, use the apartment area that matches your rent evidence. Applying an apartment rent per square foot to the entire gross building area would also assign rent to stairs and corridors.
For the next design review, bring the two floor plans, the area breakdown, and one question the team can act on. For these layouts, that might be: Can we shorten the corridor in Layout B while keeping its package room and preferred unit sizes? That gives the next test fit a clearer purpose than simply asking for a higher percentage.
Explore What Zenerate Can Do
In Zenerate’s Project Data, you can review net leasable area, gross floor area, and efficiency ratios by building use. Start with the residential figures for two layouts, check what each total includes, and return to the floor plans to see what changed. Once you understand the area difference, use Financial Settings to review the rent assumptions behind your comparison.
Book a Demo + Start a Free Trial