Zenerate provides detailed project data—available directly within the platform interface—to give users full visibility into project data.
Users can view these vital project details on the left-hand panel under each solution card, ensuring quick access to project-critical information without disrupting the design workflow.
Here are the four main project data breakdowns available to every project:
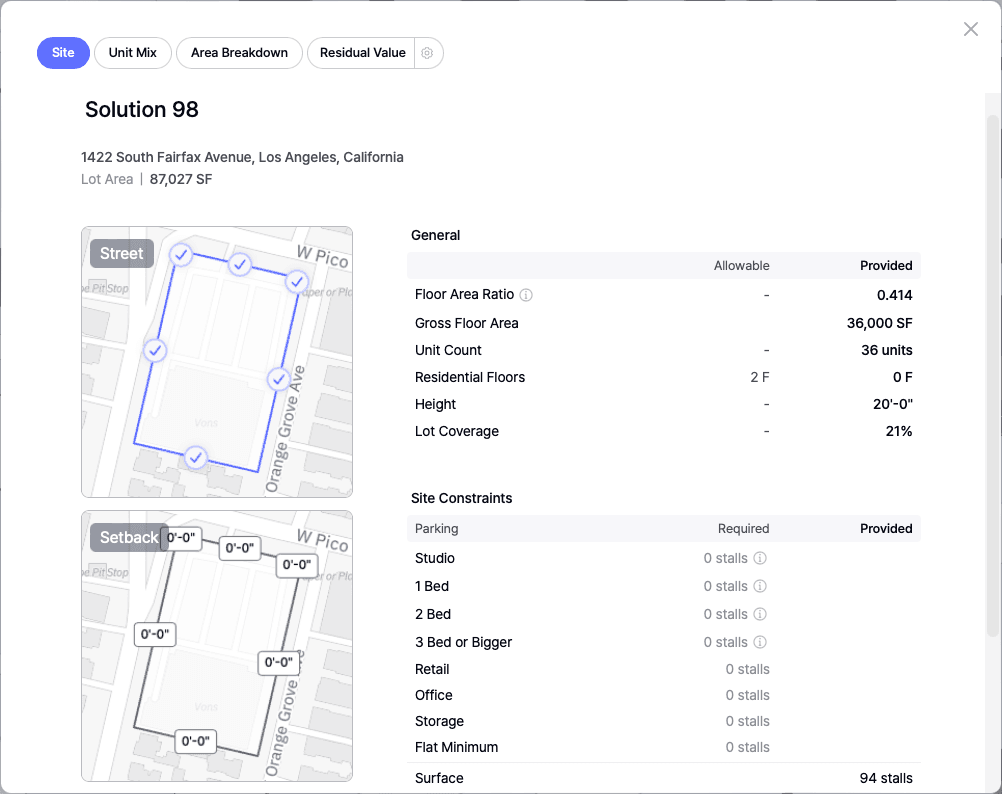
Site
This section provides a comprehensive summary of site-specific metrics to help users verify zoning, density, and parking requirements:
• Street Side and Setback Visualization
• Lot Area
• Allowable vs. Provided FAR (Floor Area Ratio), GFA (Gross Floor Area), and Unit Count
• Required Parking Stalls vs. Provided Stalls
These details are crucial for architects and developers during early site feasibility analysis to ensure all designs stay within code and density limits.
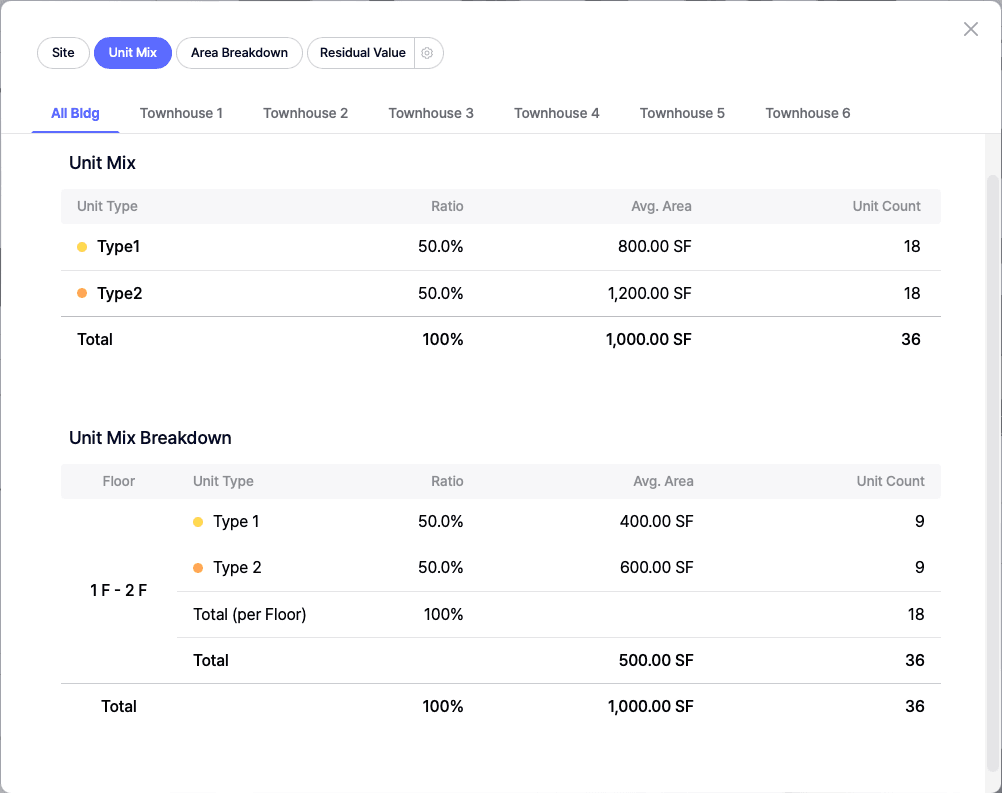
Unit Mix
The Unit Mix section helps users fine-tune residential unit planning, especially for multi-family and mixed-use developments:
• Unit Mix Summary: Displays ratios, average unit areas, and the number of units per bedroom type
• Unit Mix Breakdown by Floor Level: Shows distribution of unit types across different building levels
This ensures developers and designers maintain the desired market-fit mix of units across floors while balancing efficiency and profitability.
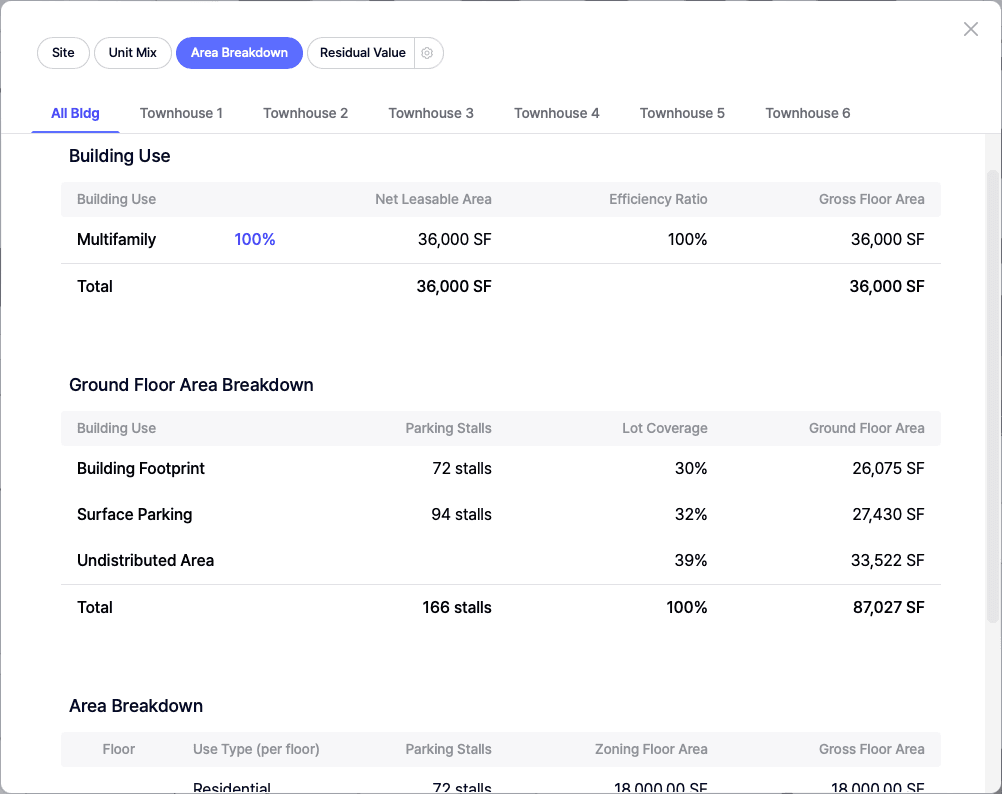
Area Breakdown
Depending on the building type and site configuration, users can switch between tabs for aggregated or building-specific data:
All Bldg (Buildings)
Provides a total overview of all structures on the lot:
• Building Use Breakdown: Includes use types (residential, retail, parking), Net Leasable Area (NLA), Efficiency Ratios, Gross Floor Area (GFA)
• Ground Floor Breakdown: Summarizes how the ground floor is allocated (parking, zones, amenity space), with data on stalls, lot coverage, and usage per building use
• Overall Area Breakdown: Details building area by use type, parking, zoning floor area, and GFA across all structures
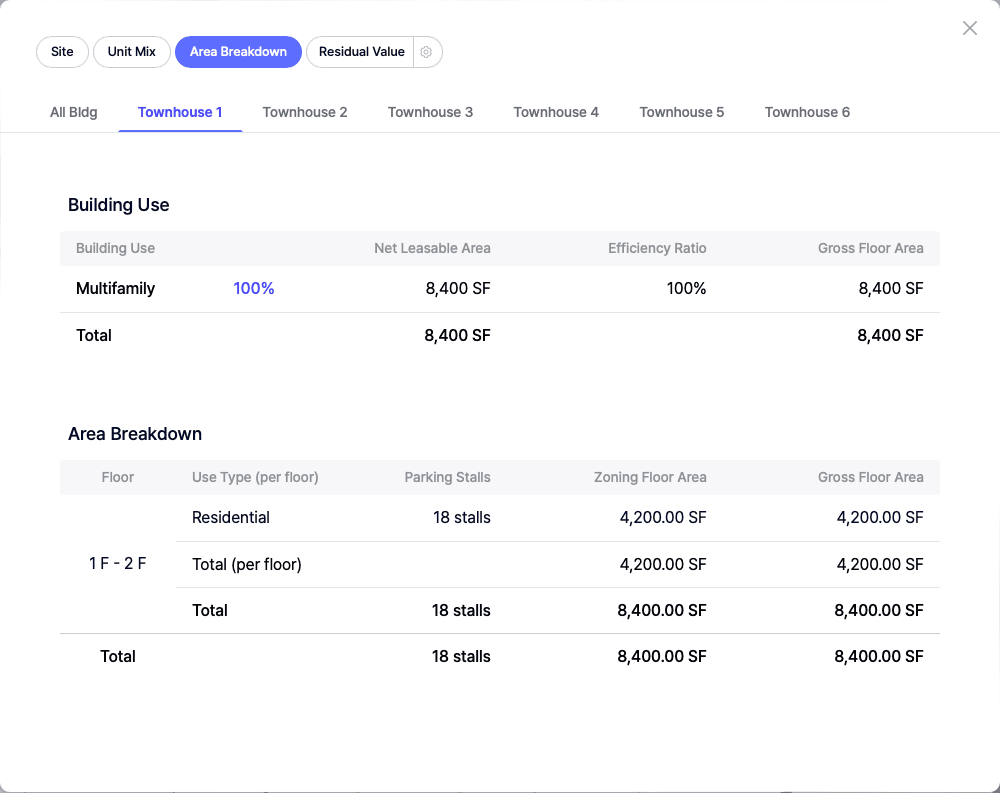
Individual Building Tabs (Residential/Townhouse/Podium)
Drill-down view for each building on the site:
• Building Use Metrics: Use types, NLA, Efficiency Ratios, GFA
• Area Breakdown: Same as the "All Buildings" tab but segmented for each structure
This gives architects and contractors precise control over building performance and space utilization.
Financials
Zenerate supports multiple financial evaluation methods, ensuring that developers and real estate investors can quickly assess project viability. Financial data becomes available once users set the desired financial method. The tab label dynamically reflects the selected method (e.g., NOI & Cost, YOC & Margin, or Residual Value).
NOI & Cost
For projects focused on rental income and development cost tracking:
• Net Operating Income (NOI)
• NOI Breakdown by Building Type
• Construction Cost with per-unit or per-use breakdown
YOC & Margin
For developers calculating Yield on Cost and profit margins:
• NOI
• Project Cost
• Cost Per Unit
• Yield on Cost
• Sales Value, Profit, and Margin
• Project Cost Breakdown per Unit Type

Residual Value
For land valuation and profitability assessment:
• First-Year NOI
• Project Cost
• Projected Sales Value
• Profit Margin
• Residual Land Value
• Detailed Construction Cost and NOI by Building

These insights allow real estate developers to determine whether a project meets their investment return criteria, ensuring informed decision-making before land acquisition or construction begins.
Users can easily update the financial settings by clicking the gear icon located next to the current financial method display.

Explore What Zenerate Can Do
Ready to accelerate your feasibility studies? Book a demo with us today and get a free trial to see how fast site planning can be done.